Interest Rates
Approaching 5% - Buy Now! Homes
Still Priced Like 2005
The
next-generation bomber built in Melbourne and next generation
rocket facilities nearly complete in Merritt Island are having a
major boosting effect on Brevard's economy. For-Sale Inventory
still hovers near all-time lows, frustrating buyers and raising
prices. Single-Family prices are steady. Single Family prices are
221% above the bottom; condos are 228% above the bottom.
Anticipating soaring inflation,
money is rushing to real estate. Blessed by good weather and low
taxes, Florida has grown more than New York, and grew the best
economy behind Texas. Spurred by yet more government intervention,
interest rates on 30-year fixed-rate mortgages still provide an
unprecedented buying opportunity. Will higher mortgage rates make
ownership more, or less, affordable than today? Rises in interest
rates will drive up your monthly payments!. Home ownership will
get very costly as mortgages rise from today's artificially low
interest rates, then add price increases detailed later in this
report..
Hire
a Realtor with local market perspective to guide your
investment. Richard Webb at Coldwell Banker Paradise,
has bought and sold Brevard properties since 1997.
Call me. you can benefit from that experience.
Lock in that 30-year fixed rate mortgage NOW! Look at the
graph on right. Interest rates jumped 41% since Oct 2016 and move
higher weekly. Real inflation is climbing as irresponsible
government spending invades the rest of the economy. But you can
harness the destructive power of inflation as it eats away the
principal of your mortgage. Today, the difference between your
interest rate and the REAL inflation rate (about
6%) is a risk-free and tax-free return on investment never
before seen in the history of the world! (I checked)
The next major
crisis in real estate could be interest rates skyrocketing beyond
the 20% of the late 1970’s. You may not see interest rates this
low again in your lifetime. Lock in your price and mortgage NOW
while fixed-rate mortgages are still available!
We insiders know living on the
SpaceCoast is warm and relaxing! Now everyone else is discovering
the secret of favorable real estate prices in Central Florida.
This comprehensive monthly report shows you the investment
potential that accompanies owning property in Brevard County.
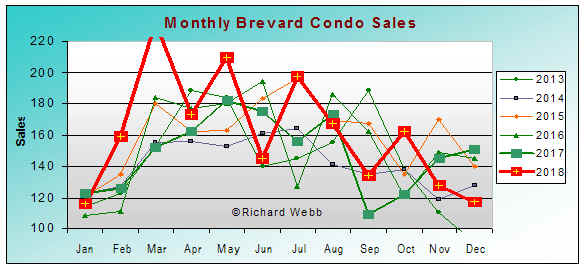
Brevard condo prices tend to
forecast single-family prices as shown in the following graphs.
Buyers are having difficulty
finding the home/condo they want, and pent-up demand increases as
buyers wait for the right abode to come on the market. Well-priced
homes get snapped up quickly, with multiple offers. Prices are
rising in response to lack of inventory. Bidding wars are common.
Strong sales kept inventory at low levels, accelerating the price
rise that started April 2010. Cash buyers (which indicate a strong
investor presence) now account for 40% of all Brevard sales, down
from 50% in early 2012. That is a positive trend as
owner-occupants rejoin the investors.
When in a Buyers
Market - BUY. The real
beneficiaries have been the smart buyers, buying while prices and
mortgage rates were even lower and everyone else was afraid to
buy.
Investors Low
interest rates, and a population moving to rentals, made
landlording feasible again. Brevard demand is driven by a
high-tech jobs base PLUS vacation/retirement homes for baby
boomers. Our embedded base of working renters makes Brevard a much
better investment than retiree-dominated communities.
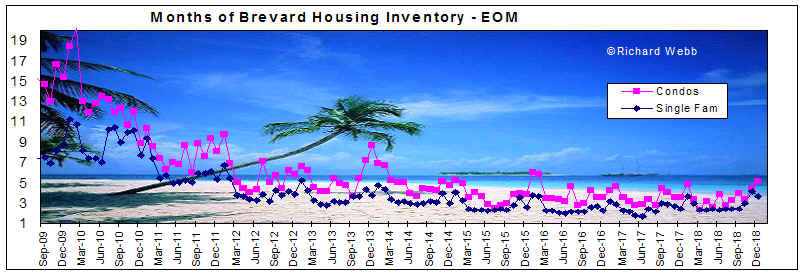
Leading Housing
Indicator Inventory
is the most important indicator to watch!
December
beginning-of-month MLS inventory 2649 Single-Family just
34% of the high
inventory in 2007!
645
Condos
just 23% of the
high inventory in 2007!
Months of
Inventory, or absorption rate, shows how many months of sales
it would take, at the current rate, to deplete the inventory. This
is the best indicator of where the future market is headed. Demand
has been so high that sales are postponed by lack of inventory.
Buyers are waiting to find what they like, with multiple offers
the first week on market.
Inventory now stands at a low 3.7 months of Single Family,
5.1 months of Condos
Building
Permits Graph and Statistics (Housing Starts) Click this
title for our proprietary charts showing still-slow building
activity. Some builders seized an opportunity to get their crews
working and permits increased from a record low 35 per month in
November 2010, to a 5-year high of 141 in July 2013. We now
average 50. Click blue paragraph title to see recent trends.
Nicely crafted makeovers raised
prices in some resale segments (especially waterfront).
What is this home worth? These
graphs and charts reveal what's happened lately. If you'd like to
know why, see my Real Estate
eMagazine and call me for a discussion of solid economic
fundamentals powering the move to the SpaceCoast, and various
neighborhood lifestyles drawing people here.
Deal with a
knowledgeable Realtor who uses lots of great
information to benefit you.
Call Richard Webb at 321-480-5514
for buying/selling, essential market expertise,
recent updates to these numbers, and projections
of future trends.
SCROLL BOTH BARS SIDEWAYS
for current Mortgage Interest Rate
Interactive graph from the Federal Reserve
I will help you get best rates!
More graphs below
If you appreciate this detailed research
please click
Need Help?
Just call 321-480-5514
or Skype
9AM to 10PM
The Best Information - Gives You a
Winning Edge. I
built these graphs to give us some perspective on market forces setting
the prices on homes, and to help our clients negotiate the best possible
deal. Call me. You need a negotiator that digs out the best
information and knows how to use it. These Brevard county-wide
residential sales, by fellow members of both Boards of Realtors, chart
the leading edge of Brevard's overall real estate market.
Note: The following numbers still include some distressed sales that
push the graph lower. Homes on navigable waterways sell higher than
these averages.
CAUTION: Do NOT infer
that your home value has decreased this much! Prices have been
rising. Call or eMail the "Webbmaster"
for details.
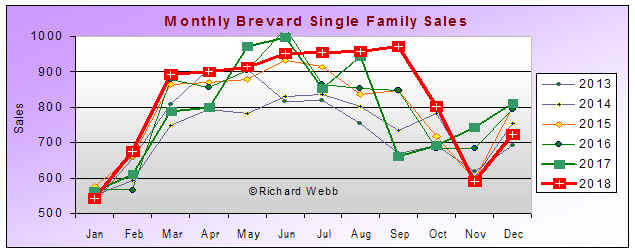
Record-setting Year over Year
Sales
Seasonal dip in sales,
more inventory, steady prices.
Source Data: MLS.
Graphs updated mid-monthly
when data matures - approx 12th.
Sales Following
Seasonal Pattern
The most cautious investment
advisors with a track record of correct predictions in 2008 are
advising transition into hard assets -- commodities and real
estate. Real estate (which you control and enjoy) sure beats
gambling in the stock market - and you can't enjoy a stock
certificate! Invest in your home.
We sell details and additional insight to financial institutions.
Contact Richard Webb
Remember: settlements
show on these charts 30 to 90 days from the time the deal was
struck. See Buyer Activity Graph. Condo
prices have fallen below SF homes due to high monthly condo HOA
fees.
What is the average sale?Nominally, homes are the
same price as 13 years ago. But after REAL
inflation (not the manipulated one in the news) they are MUCH
cheaper and rising at a sustainable rate this time.. Prices
(still a bargain) rank far below other desirable locations and below the
national Median Prices,.
When Should I Buy/Sell?Single Family prices already rebounded
220% from the low. Don't miss the rest of this buying opportunity!
Buyers get serious from early January till just before school starts in
late August. Seasonal timing can affect the price.
Pick Your Home
Averages are good for perspective, but can blur the picture. Focus on
categories of homes you're interested in, then call me for help finding
the specific one that fits your requirements.
Waterfront homes offer
the best appreciation potential. Unlike
continually expanding developments in former orange groves, they're not
making any more navigable waterfront. Including
all the islands, we have 230 miles of coastline, and that's it, so
prices get bid up faster on waterfront homes. In most areas we're seeing
neighborhoods upgrade as investor-refurbishers buy homes built in the
early days of the space program, and modernize them. Renovations push
values much higher.
Near-retirees
establishing a beachhead for retirement, or beginning to move to
Florida, want high-end homes and condos. They appreciate faster than
blue-collar homes as a result.
Note: Some people
mistakenly try to use the Tax Appraiser's values as a guide to home
pricing. That will not work in Brevard. Neither the appraiser's Market
Value nor Assessed Value offers a predictable relationship to sales
prices as evidenced by my Appraiser Ratios
analysis (click to see).
Is Demand for Real Estate
Topped Out? See the price graphs
above. Retirees are still moving to Florida, now the2nd most populous
state ahead of New York. The baby boom started in 1946 -- add 65 years
and baby boomers (who for decades have dreamed of moving to Florida)
began to retire en masse in 2011. Many home shoppers plan ahead (a
characteristic that made them successful in the first place) and
purchase early.. Average condo sales prices bottomed out in September
2010, single-family sales prices bottomed out in March 2011.
Brevard Investment
Outlook Grumman won the largest
bomber contract in a decade adding 1,500 jobs in Melbourne to build
them.
We still launch rockets.
Private manned launch preparations also keep us busy, but with 1/10 the
labor force, making us more internationally competitive. Jeff
Bezos Blue Origin completed a 500k sqFt rocket assembly facility. The
company is investing more than $200 million in local infrastructure and
is gearing up to employ more than 300 people. The shuttle layoffs
prompted diversification into other hi-tech ventures that helped
recovery. Younger workers are returning. Older ones planned to retire
here; long-timers stayed because their house is mortgage-free and job
prospects are better than elsewhere.
Harris Corporation built
a $100 Million Hi-Tech Engineering Center. Bertram Yachts moved from
Miami to Merritt Island.
An exciting $100 million
cruise terminal completed in December 2014, with another one on the way.
Royal Caribbean's Oasis of the Seas (world's largest cruise ship with
7,800 souls on board) now calls Canaveral home. We previously built a
$22million terminal for 2 new Disney super-cruisers. Two container
cranes and a new 250,000sqFt warehouses on US1 adjacent to TICO airport
are in operation.
A new natural-gas power
plant rose in Port St John. Companies in Melbourne are desperately
looking for engineers. We replaced NASA jobs with private-sector
leadership in hi-tech industries.
Troubled Sales Abated
Condo Prices (see graph above) have
increased significantly since September 2010. Last winter, sales over
$500k were 5% of the market compared to 11% of the market 6 months
prior, while sales of units under 1,000 sqFt remained constant. Troubled
sales (short or lender-owned) have reduced to only 20% of Total Sales.
Period
Standard
Sales
Total
Sales
Ratio
Sept
2013
362
657
55
Sept
2014
492
783
62
Sept
2015
681
844
80
Contrary to what you read in the
press, we studied premium waterfront home sales and discovered
that on Indian River, Banana River and Newfound Harbor, prices have
yet to rise significantly, but volume is too low for much confidence in
price comparisons.
Oceanfront is excluded here because prices overpower the data and skew
the analysis.
Year
Average
Waterfront
Sale Price
Number
of Sales
Over
$1 Million
2005
817,000
69
41
2006
895,000
32
27
2007
1,004,000
65
28
2008
839,000
63
16
2009
699,000
84
16
2010
678,000
101
16
2013
652,254
113
13
2014
679,000
109
19
2016
660,388
121
16
Perspective
Government bail-outs induced
irresponsible lenders to give undeserved mortgages to irresponsible
buyers who could not, or would not, honor their commitments. It will
take awhile until the last foreclosures are out of the market, but banks
are no longer dumping inventory in high volume. Panicked sellers who
pushed the market down hard are gone. Now we are seeing a renewed upward
trend as retirees continue to move here. Take advantage while you
can.
Our studies show homes
are still selling at 95% of asking price. When the asking price is set
realistically, a large number of homes have sold at full asking price or
above. Multiple offers on one home are common.
New Economics Did
you notice that the largest credit card issuers doubled their minimum
monthly payment a few years ago? That's one great way to curb
irrational exuberance -- a brilliant new monetary strategy. But the sudden
doubling triggered the mortgage crisis! Construction workers with
mortgages based on tenuous overtime wages could no longer pay their
credit cards and that triggered defaults on their no-down mortgage. The
doubling drastically cut consumer mis-spending, and was done with quiet
government approval; otherwise banks would have been in illegal
collusion. This was a revolutionary method of reducing borrowing in
precisely the sector that defaults on debt due to their irrational
exuberance. It was more effective than the Fed increasing reserve
requirements to curb lending. We watched its positive effect on lowering
inflation and interest rates, while the uninformed press whined about
negative effect on credit card borrowers and how consumers were not
spending enough. Meanwhile, jobs, wages and productivity (the only
worthwhile measures of an economy) got devastated in the ensuing crash.
Investors
Call Richard Webb, a fellow investor, for expert help selecting
properties with the highest total return in your portfolio. Sometimes
half of my buyers and sellers hold real estate licenses in Florida or
other states. I am a Realtor's Realtor backed by an office of 250
specially selected expert staff and agents in 8 offices of the Coldwell
Banker Paradise / Ed Schlitt Realtors team, the most respected
professionals on the Space and Treasure coast. We're everywhere you want
to be along the Indian River.
This article morphs slowly over time, but the statistics
are updated approximately the 12th of each month.
.
Contact the WEBBmaster for help finding the
perfect home or business location,and
updated details
Meet Richard Webb
URL: http://4Brevard.com/brevard-trends.shtml
Last Modified
Linking and quoting (with attribution to 4Brevard.com) is
encouraged; copying and reprinting this data for commercial use
prohibited.
Res=
residential Att=attached
condos/townhomes. Number is units sold by MAAR members.
Note: Sales may be skewed toward south and central Brevard, and new
construction
Perspective: WATERFRONT Home &
Condo Sales (MAAR)
Realtor's MLS system no longer
produces these
numbers
Res = Single
Family Residential Att =Attached
Condos/Townhomes. Number is units sold.
2005 Prices thru Dec 31
2004
Prices
2003
Prices
2002
Prices
Indian River
Res - 107
Att - 163
Avg. Sales Price
$848,767
$439,889
Sales Price per/sq.ft.
$337
$219
Banana River
Res - 76
Att - 154
Avg. Sales Price
$804,566
$354,495
Sales Price per/sq.ft.
$311
$225
Sykes Creek
Res - 48
Att - 7
Avg. Sales Price
$510,414
$292,685
Sales Price per/sq.ft.
$245
$173
Lakefront
Res - 927
Att - 189
Avg. Sales Price
$360,490
$228,977
Sales Price per/sq.ft.
$168
$162
Ocean Front
Res - 25
Att - 439
Avg. Sales Price
$1,238,768
$482,233
Sales Price per/sq.ft.
$476
$300
Newfound Harbor
Res - 7
Att - 0
Avg. Sales Price
$522,142
$0
Sales Price per/sq.ft.
$231
$0
Canal - Navigable
Res - 246
Att - 36
Avg. Sales Price
$564,860
$332,790
Sales Price per/sq.ft.
$265
$236
Canal - Drainage
Res - 224
Att - 43
Avg. Sales Price
$233,510
$152,152
Sales Price per/sq.ft.
$137
$144
Other
Res - 128
Att - 98
Avg. Sales Price
$347,342
$254,200
Sales Price per/sq.ft.
$188
$186
Indian River
Res - 122
Att - 165
Avg. Sales Price
$823,143
$337,290
Sales Price per/sq.ft.
$278
$181
Banana River
Res - 80
Att - 155
Avg. Sales Price
$743,230
$265,438
Sales Price per/sq.ft.
$246
$180
Sykes Creek
Res - 60
Att - 7
Avg. Sales Price
$386,377
$238,750
Sales Price per/sq.ft.
$203
$179
Lakefront
Res - 905
Att - 158
Avg. Sales Price
$286,032
$181,525
Sales Price per/sq.ft.
$132
$130
Ocean Front
Res - 34
Att - 558
Avg. Sales Price
$1,194,367
$382,848
Sales Price per/sq.ft.
$411
$243
Newfound Harbor
Res - 12
Att - 3
Avg. Sales Price
$570,758
$257,333
Sales Price per/sq.ft.
$233
$152
Canal - Navigable
Res - 273
Att - 46
Avg. Sales Price
$453,105
$234,013
Sales Price per/sq.ft.
$212
$163
Canal - Drainage
Res - 199
Att - 5
Avg. Sales Price
$165,491
$150,660
Sales Price per/sq.ft.
$101
$108
Other
Res - 185
Att - 125
Avg. Sales Price
$264,243
$161,941
Sales Price per/sq.ft.
$136
$142
Indian River
Res - 95
Att - 125
Avg. Sales Price
$487,523
$161,857
Sales Price per/sq.ft.
$197
$118
Banana River
Res - 83
Att - 135
Avg. Sales Price
$487,976
$194,774
Sales Price per/sq.ft.
$208
$138
Sykes Creek
Res - 49
Att - 5
Avg. Sales Price
$289,696
$232,910
Sales Price per/sq.ft.
$147
$123
Lakefront
Res - 789
Att - 129
Avg. Sales Price
$222,568
$138,772
Sales Price per/sq.ft.
$106
$99
Ocean Front
Res - 33
Att - 608
Avg. Sales Price
$939,863
$287,442
Sales Price per/sq.ft.
$327
$184
Newfound Harbor
Res - 12
Att - 2
Avg. Sales Price
$445,925
$168,500
Sales Price per/sq.ft.
$161
$113
Canal - Navigable
Res - 250
Att - 40
Avg. Sales Price
$338,717
$173,502
Sales Price per/sq.ft.
$165
$123
Canal - Drainage
Res - 150
Att - 3
Avg. Sales Price
$136,917
$189,500
Sales Price per/sq.ft.
$83
$106
Pond
Res - 120
Att - 72
Avg. Sales Price
$182,283
$124,752
Sales Price per/sq.ft.
$102
$103
Indian River
Res - 84
Att - 92
Avg. Sales Price
$489,396
$128,919
Sales Price per/sq.ft.
$172
$98
Banana River
Res - 69
Att - 110
Avg. Sales Price
$442,564
$153,590
Sales Price per/sq.ft.
$177
$112
Sykes Creek
Res - 41
Att - 14
Avg. Sales Price
$262,102
$187,878
Sales Price per/sq.ft.
$140
$99
Lakefront
Res - 554
Att - 117
Avg. Sales Price
$207,705
$118,066
Sales Price per/sq.ft.
$98
$80
Ocean Front
Res - 27
Att - 539
Avg. Sales Price
$679,144
$243,343
Sales Price per/sq.ft.
$252
$150
Newfound Harbor
Res - 7
Att - 6
Avg. Sales Price
$355,628
$172,233
Sales Price per/sq.ft.
$132
$102
x
Canal - Navigable
Res - 240
Att - 39
Avg. Sales Price
$289,902
$168,012
Sales Price per/sq.ft.
$138
$113
Canal - Drainage
Res - 100
Att - 3
Avg. Sales Price
$122,453
$65,833
Sales Price per/sq.ft.
$74
$69
Pond
Res - 39
Att - 34
Avg. Sales Price
$217,962
$138,032
Sales Price per/sq.ft.
$102
$102
Source:
Melbourne Florida Area
Association of Realtors
(MAAR) Annual MLS Sold Statistics Report - Waterfront
ALL Home & Condo
Sales (MAAR)
2005
Prices thru July 15 2005
2004
Prices
2003
Prices
2002
Prices
Total Sales - 6152 units
2 BR
281
Avg. Sales Price $183,538
3 BR
3062
Avg. Sales Price $233,360
4 BR
1215
Avg. Sales Price $340,036
Condos
1432
Avg. Sales Price $274,008
Compared to 2004:
Reflects a 43% increase in
overall sales with average sales
prices increasing by 27 %
Time on Market of Units Sold
Days
#S/Fam
#Condo
1-30
441
139
31-60
1886
477
61-90
1170
309
120+
592
190
91-120
616
309
Residential with in-ground pool
- 1179
Avg. Sales Price
$380,070
Sales Price per/sq.ft.
$179
Golf Course
Res - 112
Att - 60
Avg. Sales Price
$345,080
$211,710
Sales Price per/sq.ft.
$157
$154
1 Acre +
Res - 259
Att - 23
Avg. Sales Price
$476,957
$491,578
Sales Price per/sq.ft.
$188
$206
Total Sales - 10794 units
2 BR
556
Avg. Sales Price $123,928
3 BR
5340
Avg. Sales Price $177,624
4 BR
2164
Avg. Sales Price $283,520
Condos
2425
Avg. Sales Price $212,865
Compared to 2003:
Reflects a 7 % increase in
overall sales with average sales
prices increasing by 28 %
Time on Market of Units Sold
Days
#S/Fam
#Condo
1-30
873
291
31-60
3369
893
61-90
1863
470
120+
980
239
91-120
1249
525
Residential with in-ground pool
- 2046
Avg. Sales Price
$316,224
Sales Price per/sq.ft.
$147
Golf Course
Res - 150
Att - 111
Avg. Sales Price
$280,893
$170,202
Sales Price per/sq.ft.
$127
$119
1 Acre +
Res - 490
Att - 52
Avg. Sales Price
$378,262
$378,403
Sales Price per/sq.ft.
$152
$187
Total Sales - 10046 units
2 BR
533
Avg. Sales Price $99,220
3 BR
4940
Avg. Sales Price $141,778
4 BR
1963
Avg. Sales Price $229,619
Condos
2405
Avg. Sales Price $160,301
Compared to 2002:
Reflects an 18% increase in
overall sales with average sales
prices increasing by 15 %
Time on Market of Units Sold
Days
#S/Fam
#Condo
1-30
579
188
31-60
2470
781
61-90
1816
522
91-120
1056
299
120+
1687
600
Residential with in-ground pool
- 2011
Avg. Sales Price
$239,111
Sales Price per/sq.ft.
$115
Golf Course
Res - 141
Att - 108
Avg. Sales Price
$246,806
$125,026
Sales Price per/sq.ft.
$107
$91
1 Acre +
Res - 477
Att - 16
Avg. Sales Price
$259,891
$216,012
Sales Price per/sq.ft.
$113
$141
Total Sales - 8508
units
2 BR
494
Avg. Sale $78,348
3 BR
4221
Avg. Sale $124,505
4 BR
1576
Avg. Sale $205,535
Condos
2052
Avg. Sale $137,313
Versus 2001:
Reflects a 10 % increase in
overall sales with average sales
prices increasing by 16 %
Time on Market of
Units Sold
Days
#S/Fam
#Condo
1-30
554
215
31-60
2031
686
61-90
1487
421
91-120
868
249
120+
1505
478
Residential with
in-ground pool - 1787
Avg. Sales Price
$214,156
Sales Price per/sq.ft.
$102
Golf Course
Res - 141
Att - 87
Avg. Sales Price
$200,255
$110,471
Sales Price per/sq.ft.
$92
$78
1 Acre +
Res - 384
Att - 0
Avg. Sales Price
$229,470
Sales Price per/sq.ft.
$99
Source:
Melbourne Florida Area
Association of Realtors
(MAAR) Annual MLS Sold Statistics Report - All Areas